ALL YOUR PAID MARKETING Data VisualizeD
– with Kemb Report
Know HOW and HOW WELL your money is spent

SEA Report – Key Features

Simplify Analysis, Amplify Success
Time is of the essence in the fast-paced world of marketing. Why waste it navigating through various platforms when you can accomplish everything in one place? Our reporting product brings together data from Google, Bing, LinkedIn, Facebook, and more, all in a single, intuitive dashboard. We streamline your workflows, helping you drive results and propel your business forward.

Keep an eye on your main metrics
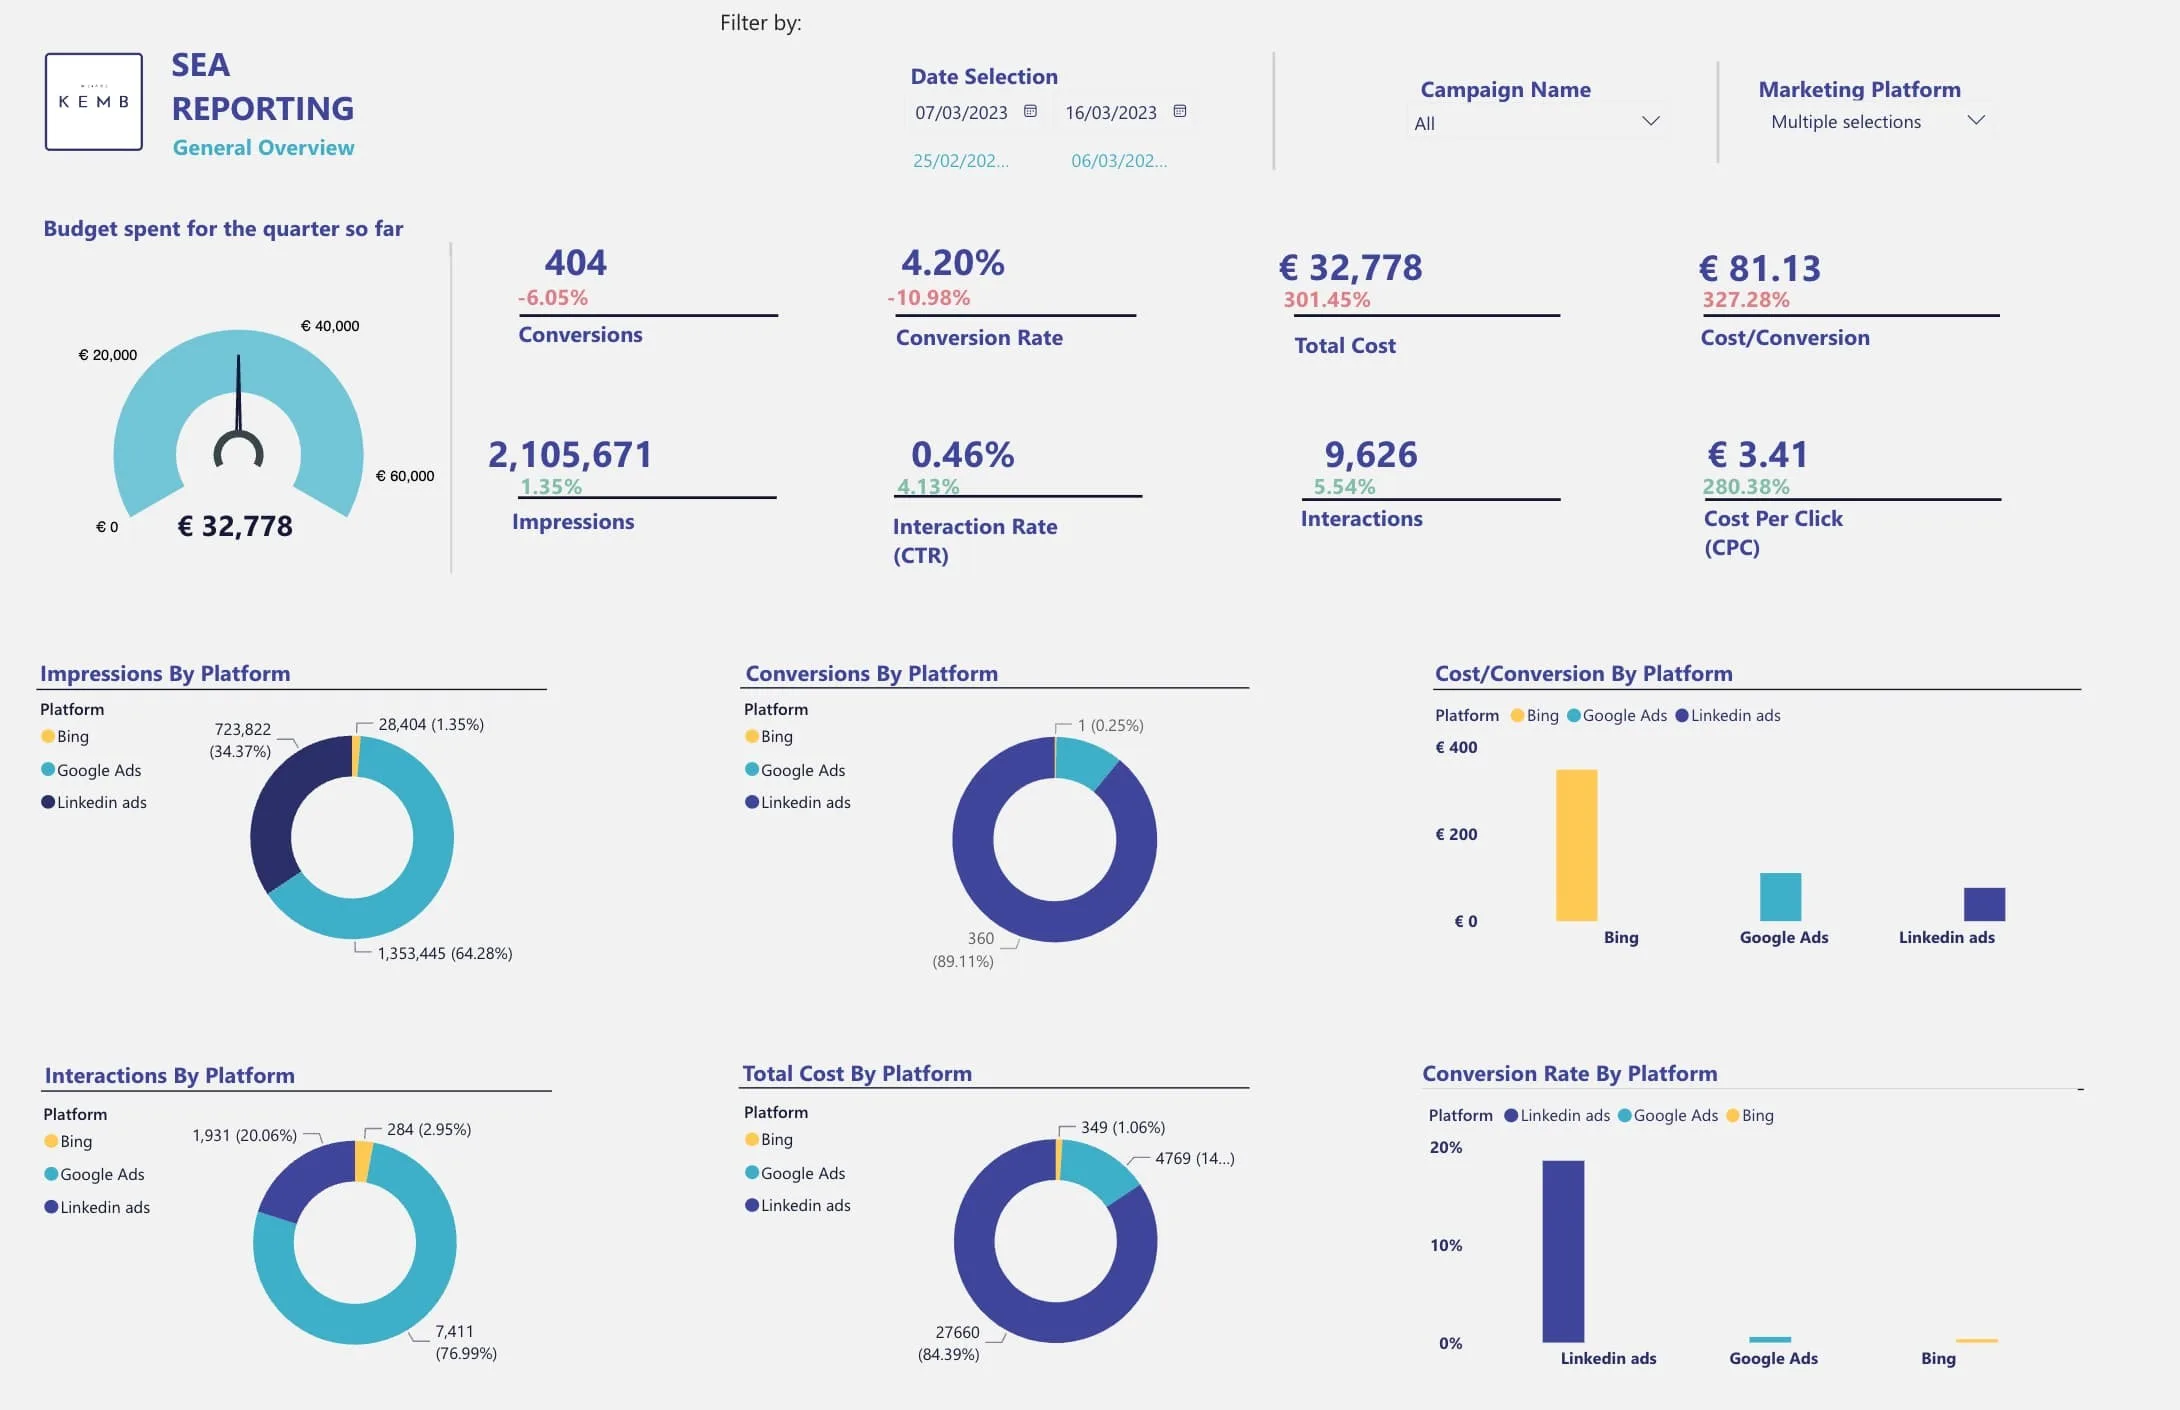
Our integrated solution streamlines metrics from varying sources, enabling you to measure and compare platform performance effortlessly and offering a comprehensive view of your marketing campaigns. Now, you can focus on what truly matters – elevating your marketing strategies for unparalleled success.

Real-Time Insights, Real-Time Success
Stay ahead of the curve with daily updated insights. Our SEA product provides the analytics to ensure you’re always equipped with the latest information and ready to react quickly to any changes in your marketing landscape. By leveraging daily data, you can adapt on the fly and seize every opportunity that comes your way.
Would you like to try it out?
Please don’t hesitate to try our SEA Reporting Demo for yourself directly. You’ll want to see more after your first few clicks! Find out for yourself!
You are certainly trying to view our demo on a mobile device. To ensure the best user experience, we would like to recommend switching to your desktop device. But until then, feel free to take a look at the following video to get a first impression.

For both veterans and newcomers
We understand that your marketing team is diverse, with varying levels of technical expertise! That’s why our SEA product caters to both seasoned marketers and newcomers alike. For those seeking a high-level understanding of their campaigns, our user-friendly dashboard provides an insightful overview, ensuring that even non-technical individuals can grasp the bigger picture.

From Top-level to In-Depth Insights
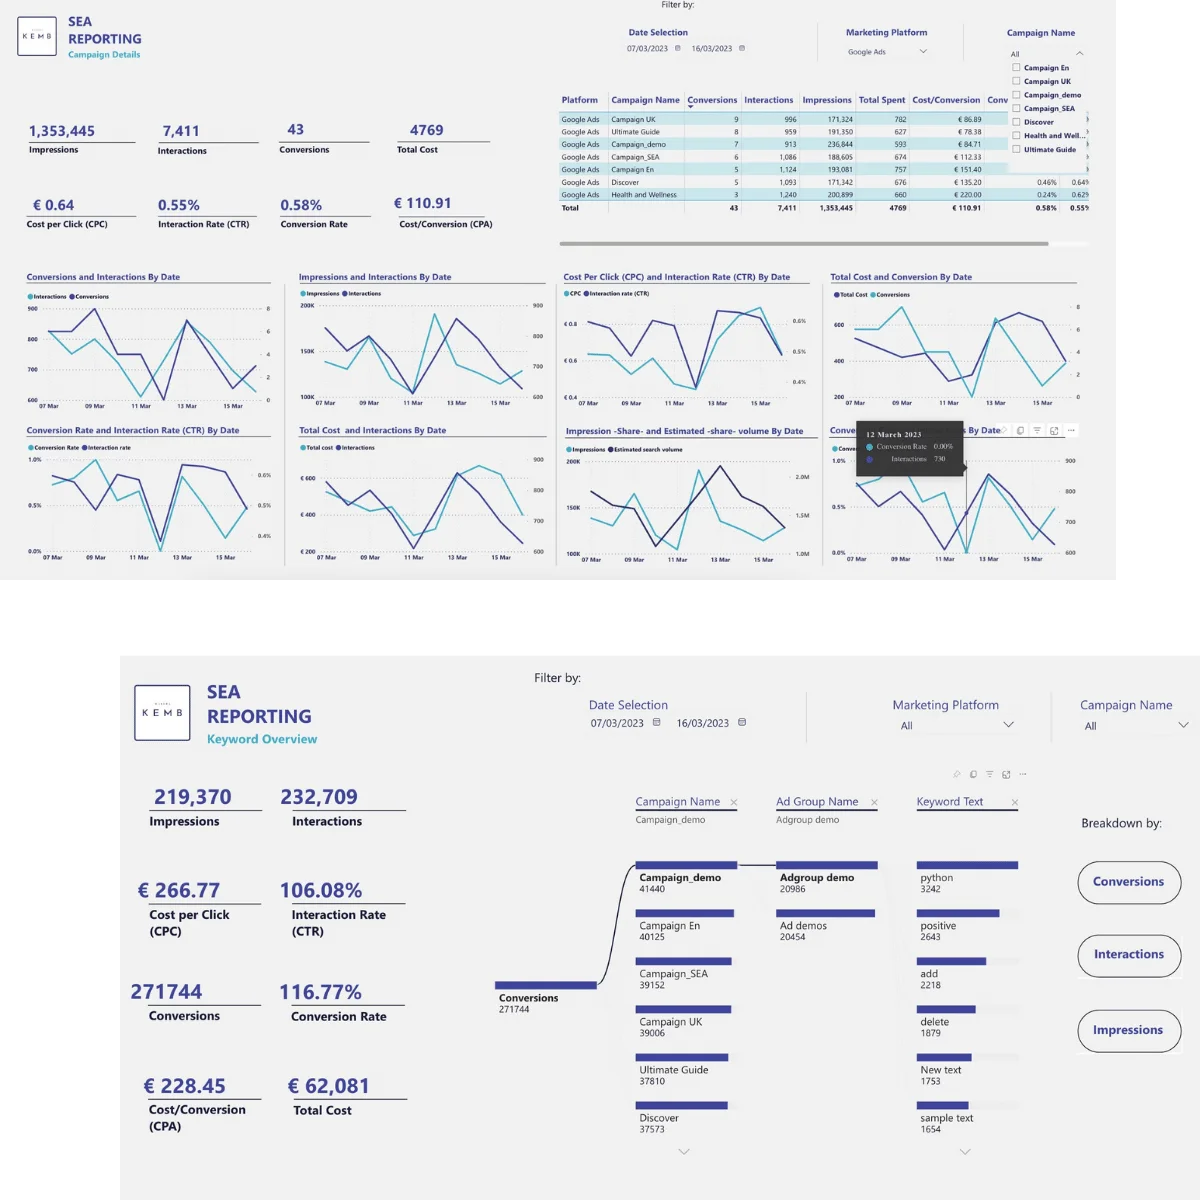
Of course we’ve also designed the most granular dashboards for the data enthusiasts. So that you can dive deep into campaign performances, analyze every metric, and uncover hidden opportunities for optimization. No matter your skill level, our product is crafted to empower everyone on your team.
Make more out of your Marketing data…
Don’t get us wrong. We don’t think Paid Ad Platforms are bad by any means. On the contrary. These platforms have incredible Analytics to offer. The caveat? The interfaces are rarely intuitive, not accessible to newcomers and there are several of them between which you constantly need to switch. Furthermore, plotting is limited to the graphs each platform provides and not tailored to what you – the User – needs.

…and use your time to take actual action
With clear visualizations, automatically integrated comparisons to the previous month to immediately shed light on significant changes + a continuous month-over-month overview for all your important metrics, you can now capture data much more quickly and save your time to focus on actual campaign optimization work rather than finding your way through the maze of Paid Ad interfaces.
Choose your plan and join today
is there a perfect time to try something new? Well, maybe today: Hop on one of our SEA Report Packages now and save up to 33% for your first three months!
Lite Package
149€/month
now for 99€/month*
*Limited offer for our early adopters: save 49€ per monthly on your first three months
Connect up to four Accounts: Google Ads, Microsoft Bing, and LinkedIn and Meta Ads included
SEA Platforms Performance Overview
High Level Reporting per Channel
Unlimited Users
The ideal setup for smaller businesses to get a high level understanding of their campaigns’ performance
Advanced Package
249€/month
now for 199€/month*
*Limited offer for our early adopters: save 49€ per monthly on your first three months
This package includes of course all components of the Lite package plus:
Drill-down Analytics from campaign to keyword-level
Keywordlevel Impressionshare Analysis
This setup is best suited for most companies that not just need a proper real-time report of their paid efforts but also perform in-depth analytics on the operational level
Pro Package
399€/month
now for 349€/month*
*Limited offer for our early adopters: save 49€ per monthly on your first three months
In addition to all components of the advanced package, our Pro offering also covers:
Customized KPI Visualisations depending on your specific requirements
Customized CRM Data Integration (e.g. Hubspot and Salesforce)
This setup is particularly suitable for professionals who rely on a comprehensive mapping of the customer journey. Integrating your CRM data enables you to connect marketing and sales and map the user journey from first contact to sale.
If you are also interested in our SEO Reporting, of course we offer great deals on packages combining both our products! You can save up to 25% if you get a subscription for both our SEO and SEA Report!
You want even more? No problem, let's talk about it
Feel free to contact us at any time, we will be happy to create a completely individual reporting for you. And of course exactly as you need it! Visit us at wearekemb.com or contact us directly and we will make sure to find the ideal solution for you!
Frequently Asked Questions
What data is included in the Kemb SEA Reporting?
The Kemb SEA Reporting aims to include your data from all relevant Online Marketing platforms. Currently incorporated are Google Ads, Microsoft (Bing) Ads, Meta (Facebook) Ads, and LinkedIn Ads. The Kemb SEA Reporting will be expanded to other platforms by popular demand.
Who can use the Kemb SEA Reporting?
The Kemb SEA Reporting is designed with both top-level decision makers as well as in-depth PPC specialists in mind. Some dashboards give a comprehensive overview over all data while others allow for extensive analysis of single keywords. The interface is intuitive and does not require further technical knowledge or experience.
What questions does the Kemb SEA Reporting answer?
The Kemb SEA Reporting is designed to answer whichever questions you may have. The top-level overview answers questions concerning the cost, efficiency, and viability of different marketing platforms. Expanded metric graphing allows you to dive into detailed analyses.
How frequently is the Kemb SEA Reporting updated with new data?
The Kemb SEA Reporting dashboard is continuously updated. You and your team can check the dashboard daily for up-to-date information and numbers.
Can I drill down into specific campaigns, ad groups, or keywords for more detailed insights?
For specialised PPC experts our Kemb SEA reporting offers opportunities for in-depth analysis. Performance can be drilled down from a campaign to a keyword level. Furthermore, all important metrics are graphed at a view to enable you to draw the right conclusions
Can I customise the time period for which I want to view data?
Absolutely. You can choose the time frame for data analysis freely. For week-on-week comparisons the dashboard will automatically use the previous time period. Furthermore, data is available for an unlimited time period.
How does the onboarding work?
After you sign up for a plan, you’ll need to give us access to Google Search Console. While we connect all the necessary sources, we’ll schedule an onboarding appointment with you, where we’ll walk you through all the features of the report and clarify any questions you may still have. Of course, our support team will also be available to assist you further afterwards.
Are there any benchmarks or targets used to assess performance?
We have implemented features that enable you to assess your performance and spending based on your internal goals. To use these features, simply get in touch with us and we will make all necessary changes in your reporting. We are also currently testing an early-warning system. Once this feature is available you will receive messages whenever a performance indicator drops below a certain benchmark or target.
How is the data sourced and integrated into the dashboard?
The data is sourced directly from your Marketing platform accounts. The heart of our reporting is a model that enables you to compare data from several platforms in one dashboard. Gone are the days where you have to monitor your Google Ads, Microsoft Ads and Meta Ads performance in different dashboards. The data is then visualised within Power BI.
Your question is not answered?
In this case, please feel free to contact us at any time and we will discuss everything further with you.
